

Accounting for Consulting Services: A Complete Guide for Growing Firms
Your firm is winning new clients. Projects are coming in consistently. Revenue is growing.
Yet every month, you’re still asking the same questions:
Which clients are actually the most profitable?
Are your consultants fully utilized?
Why does cash feel tighter than your revenue suggests?
If those questions sound familiar, your finance function has likely reached a point where basic bookkeeping is no longer enough; managing a growing consulting firm takes more than tracking invoices and expenses.
That’s where accounting for consulting services becomes essential. Instead of focusing on inventory or product costs, it helps firms track project profitability, consultant utilization, revenue recognition, and cash flow, giving leadership the financial visibility needed to make smarter business decisions.
In this blog, we’ll explore what makes accounting for consulting services different, the financial metrics consulting firms should monitor, and the best practices that support sustainable growth.
Key Takeaways
- Accounting for consulting services is based on project- and time-based revenue rather than product sales, which affects how revenue is recognized and reported.
- Work-in-progress (WIP) is a core concept in consulting accounting, tracking billable work that’s been performed but not yet invoiced.
- Utilization rate, realization rate, and project margin are the metrics that actually tell you whether your consulting business is profitable, not just whether it’s growing.
- Labor is typically a consulting firm’s highest cost, so tracking needs to be done by person and by project, not just by category.
- Clean, project-level financial reporting turns your books from a tax-time formality into a tool for running the business.
What Makes Accounting for Consulting Services Different
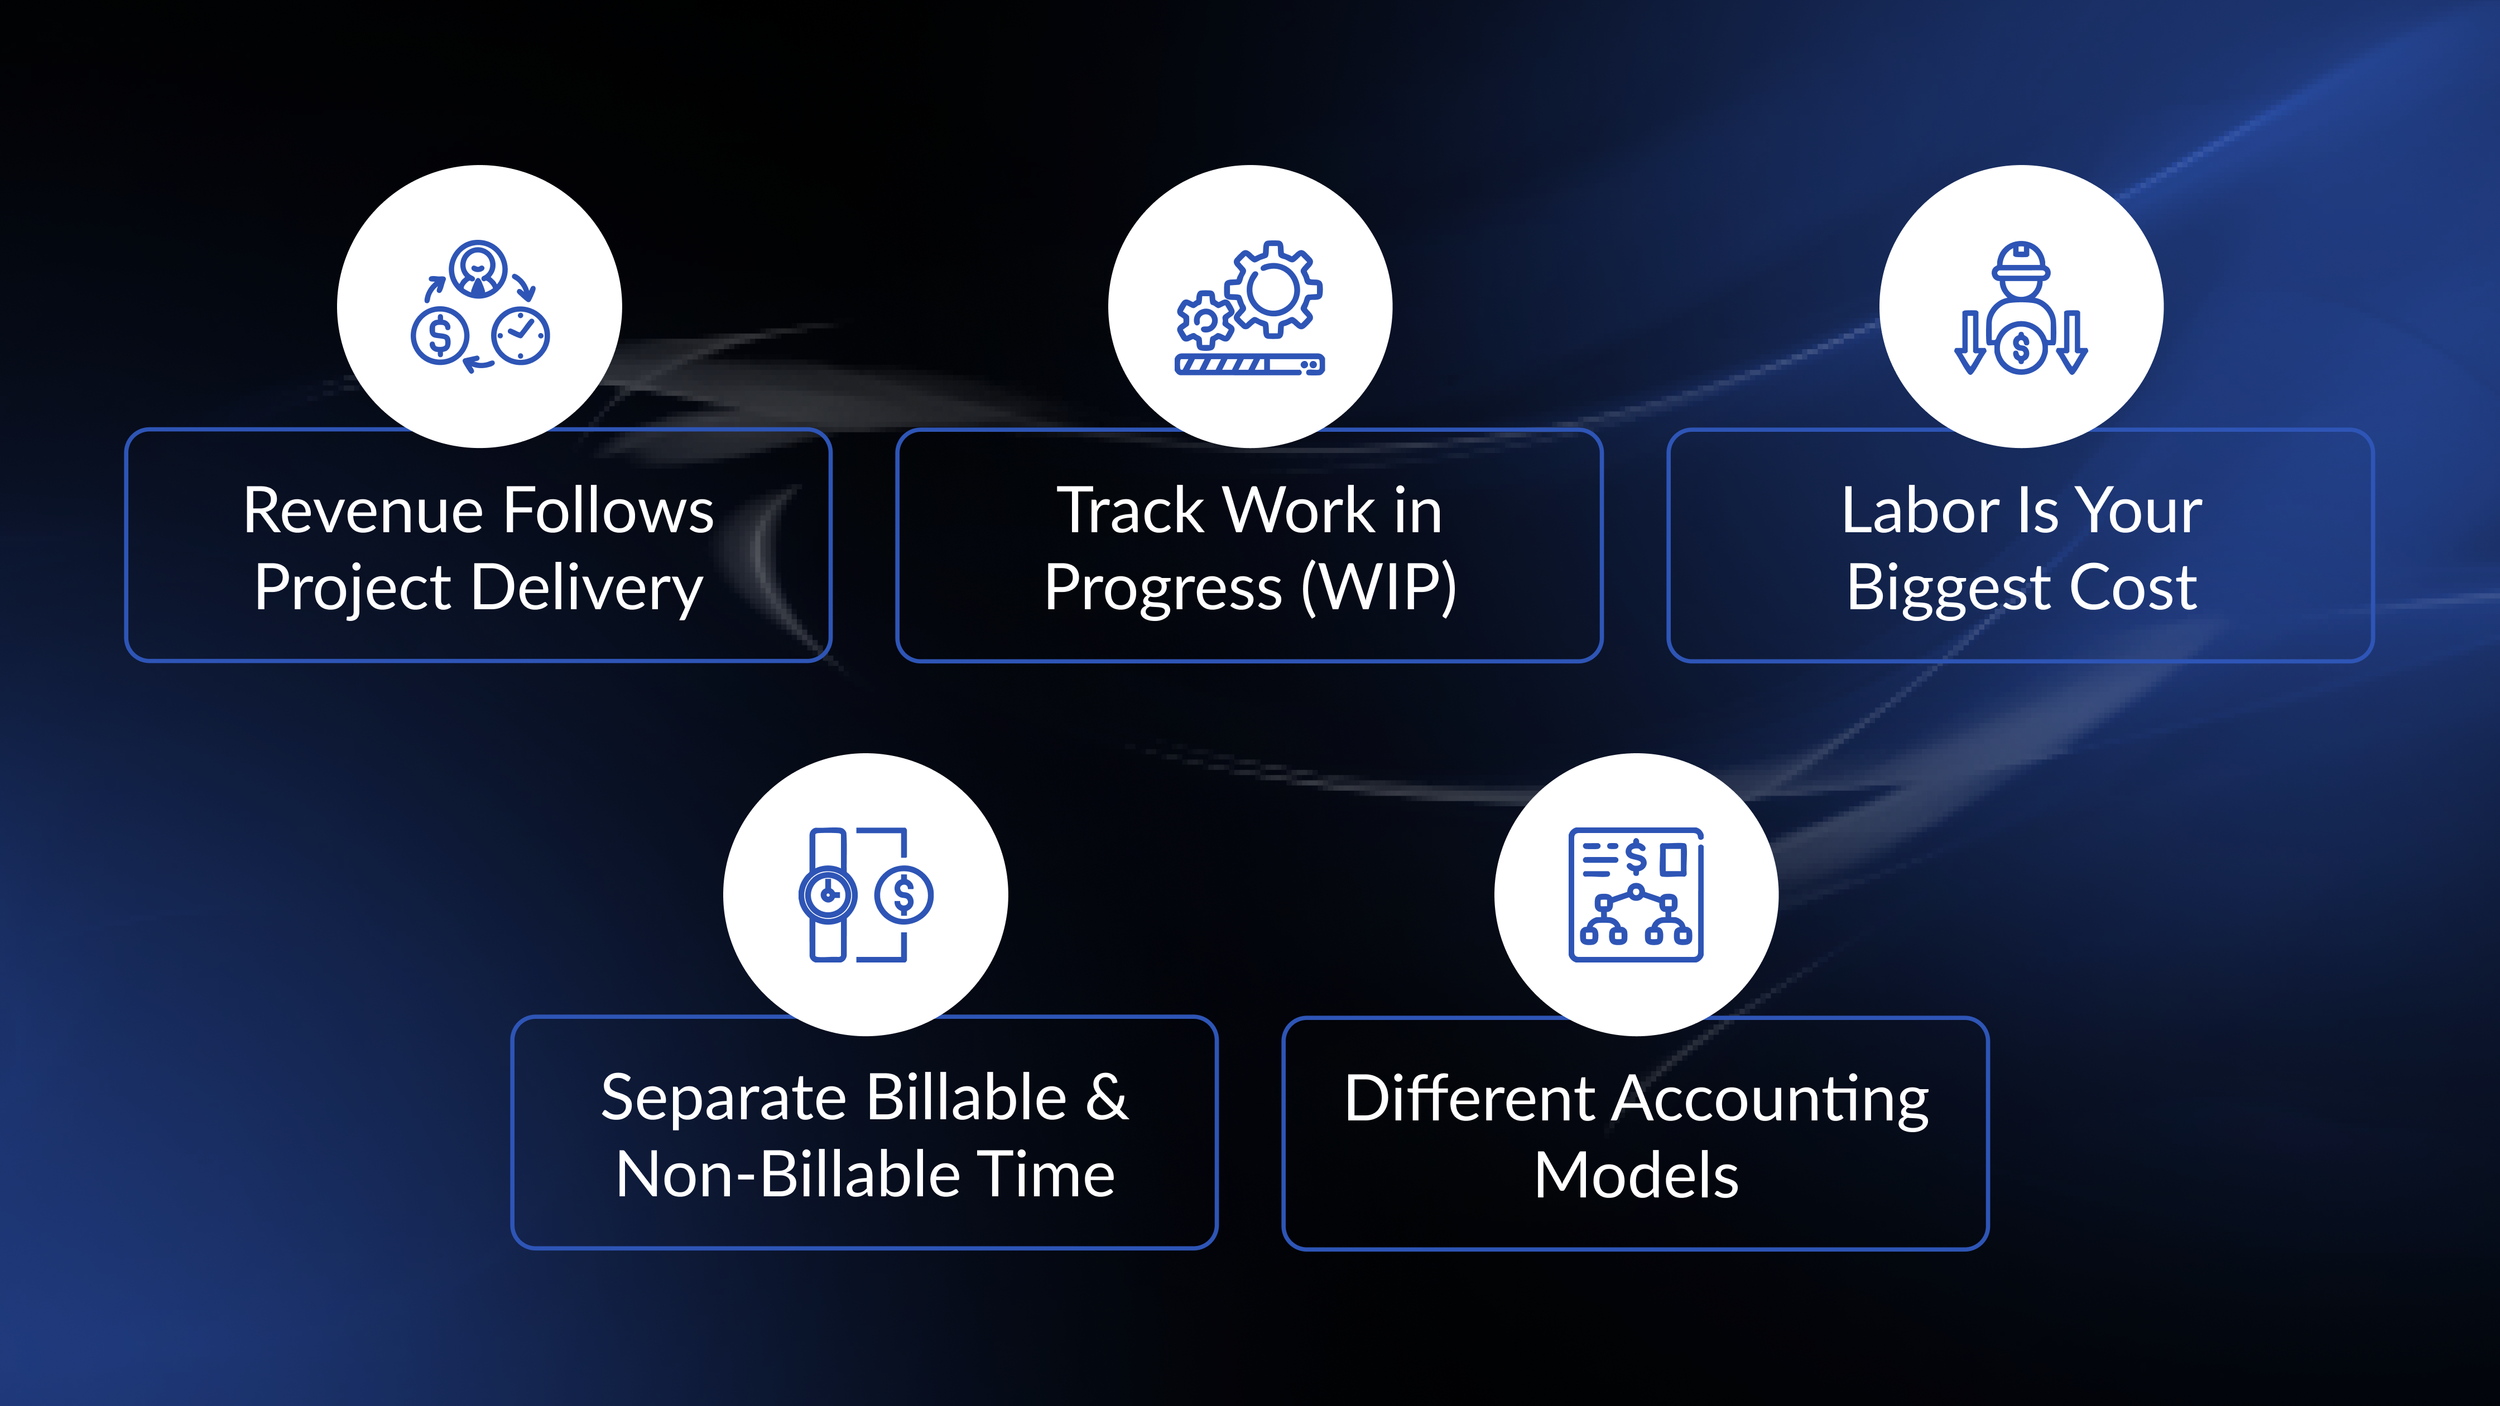
This kind of accounting applies core principles to businesses that generate revenue from client engagements, billable hours, and professional expertise rather than product sales.
That distinction is significant because two consulting firms with the same revenue can have very different financial performance, depending on how effectively they account for consulting services and measure project and client profitability.
Generic accounting approaches built for product-based businesses tend to fall short at project-level measurement, which is exactly why consulting firms need an approach designed around project-based work, billable time, and client profitability from the start.
These five differences explain what that looks like in practice:
1. Revenue Follows Project Delivery
A product business recognizes revenue at the point of sale. This approach generally recognizes revenue as work is performed, either as hours are billed, milestones are completed, or a percentage of the project is finished, meaning revenue recognition is tied to the pace of delivery rather than a single closing transaction.
2. Track Work in Progress (WIP)
Work-in-progress is billable work that’s been performed but not yet invoiced to the client, such as hours logged this week that won’t appear on an invoice until next month’s billing cycle. Without tracking WIP, a firm’s books understate what’s actually been earned, distorting everything from cash flow forecasting to the accuracy of a month’s financials.
3. Labor Is Your Biggest Cost
Product businesses build their accounting around inventory and cost of goods sold. Consulting accounting is built around labor costs, salaries, benefits, and overhead tied to the people delivering the work. This means cost tracking needs to occur at the person and project levels, not just as a lump-sum operating expense.
4. Separate Billable & Non-Billable Time
A consultant’s hours are split into two categories: revenue-generating and non-revenue-generating. Internal meetings, business development, and administrative work are all real costs, but none of them get billed to clients. This means clearly separating billable and non-billable time, since a team that appears fully utilized on paper might actually be spending a large share of its time on unbillable work.
5. Different Accounting Models
A retainer client paying a flat monthly fee and a project client billed hourly or by milestone require different revenue recognition approaches. Lumping both into the same reporting bucket makes it hard to see which type of engagement is actually more profitable for the firm.
How Different Consulting Engagements Affect Accounting
Accounting for consulting services isn’t one-size-fits-all; the way a firm tracks and reports revenue depends on the engagement model. Here’s how that plays out across the four most common structures:
| Engagement Model | What the Firm Should Track | Main Risk |
|---|---|---|
| Hourly | Recorded, approved, invoiced, and written-off hours | Revenue leakage |
| Fixed fee | Budget consumed versus work completed | Margin erosion |
| Retainer | Cash received versus services delivered | Revenue recognized too early |
| Milestone based | Completion, approval, and invoice timing | Billing delays |
Cash vs. Accrual Accounting for Consulting Firms
Before any of the differences above can be tracked accurately, a consulting firm must choose how to record revenue and expenses, and that choice shapes everything downstream.
Cash accounting records revenue when payment is actually received and expenses when they’re actually paid. It’s simple to maintain, but for a consulting firm, it tells you almost nothing about whether work currently in progress is profitable, because nothing shows up until cash changes hands, regardless of when the work was actually done.
Accrual accounting records revenue when it’s earned, as work is performed, and expenses when they’re incurred, regardless of when cash moves. This is why accrual accounting is the better fit for accounting for consulting services: it lines up revenue with the labor and costs that actually produced it, giving you a true picture of project profitability in the month the work happened, not the month the invoice finally clears.
Same engagement, two very different scenarios.
Say a consultant completes 40 hours of work in March, the invoice goes out in April, and the client pays in May:
| March (Work Done) |
April (Invoiced) |
May (Paid) |
|
|---|---|---|---|
| Cash Accounting | $0 recorded | $0 recorded | Full revenue recorded |
| Accrual Accounting | Full revenue recorded | No change, already recognized | No change, already recognized |
Under cash accounting, the engagement shows zero revenue for two full months, followed by a spike in the month least closely aligned with when the actual work occurred. Under accrual accounting, March’s financials reflect March’s work because revenue is matched to the labor cost incurred that same month.
That gap is exactly why accrual accounting is standard practice in consulting firms: a firm using cash accounting can appear unprofitable in a busy month and profitable in a slow one, purely due to the timing of invoices and payments, which has nothing to do with how the business actually performed.
How to Calculate & Track Consulting Metrics
Knowing the formula behind each metric only helps once you know roughly where you stand relative to your peers, and benchmarks vary significantly by firm type, seniority mix, pricing model, and maturity. SPI Research’s Professional Services Maturity Benchmark, the industry’s most widely used performance study, is a strong starting point.
What matters more than hitting a specific number is understanding what a shift in either direction means.
| Metric | How to Calculate | Industry Reference Point |
|---|---|---|
| Utilization Rate | Billable Hours ÷ Total Available Hours × 100 | SPI Research sets 70%+ as the minimum healthy benchmark; the 2025 industry average was 66.4%, an all-time low |
| Project Margin | (Project Revenue − Project Labor Cost − Project Expenses) ÷ Project Revenue × 100 | SPI Research considers 35%+ a signal of effective pricing and delivery management; the 2025 industry average was 37.7% |
| Realization Rate | Revenue Billed ÷ Standard Billable Value × 100 | Varies too significantly by firm type to state a general benchmark |
Source: SPI Research, 2026 Professional Services Maturity Benchmark (509 firms, 245,000+ employees, $63B in PS revenue represented).
But these metrics rarely tell the full story in isolation; it’s the combination of utilization and realization that actually reveals what’s happening:
| Utilization | Realization | Likely Issue or Outcome |
|---|---|---|
| High | High | Strong delivery performance |
| High | Low | Underpricing, overruns, or write-offs |
| Low | High | Profitable work but unused capacity |
| Low | Low | Demand or allocation concerns |
A team that’s fully booked (high utilization) but showing low realization isn’t a staffing problem; it’s a pricing or scope problem, exactly the kind of blind spot a generic accounting approach tends to miss.
Furthermore, a team with unused capacity but a strong track record of delivering its work isn’t struggling with quality; it’s struggling with demand. Evaluating the metrics together, not separately, points a firm toward the right fix rather than the wrong one.
What Is the True Cost & Margin of Every Project?
Project margin looks simple on paper: revenue minus labor cost minus expenses. In practice, most firms understate the cost side of that equation, and a project that looks profitable on a basic P&L can barely break even, or even lose money, once all real costs are accounted for.
Costs consulting firms commonly miss when calculating project margin:
Benefits & employer costs: payroll taxes, health insurance, and other employer-side costs on top of salary, not just the base pay rate
Partner & leadership time: senior time spent on a project rarely gets billed at full value, or tracked at all, even though it’s a real cost to the firm
Project management: the coordination, check-ins, and internal admin that keep a project running, separate from the billable delivery work itself
Software & travel: tools, licenses, and travel expenses tied directly to a specific engagement, rather than absorbed into general overhead
Rework & additional revisions: hours spent fixing or redoing work don’t generate new revenue, but they do consume real labor costs against the project
Contractor expenses: subcontractors or freelance specialists brought in for a specific engagement, billed against that project rather than treated as a general expense
Leaving any of these out doesn’t just slightly understate cost; it can flip a project from profitable to unprofitable once everything is actually counted.
This shows up most clearly mid-project. Let’s assume an engagement is 50% complete based on deliverables, but has already consumed 75% of its labor budget. On a simple percent-complete view, it still looks on track.
Factor in the true cost, and it’s already signaling a margin problem, one you can still fix at 50% completion. At 100%, all that’s left to do is find out how much money the firm lost.
This is why true cost needs to be tracked throughout an engagement, not just at close. The earlier the gap between budget and delivery becomes apparent, the more options a firm has to address it.
1116 Perspective | Visibility Creates Better Decisions
Strong consulting firms don’t wait until month-end to understand profitability. The firms that scale successfully build accounting for consulting services around real-time project visibility, giving leadership the confidence to adjust pricing, staffing, and resource allocation before small issues become expensive ones.
How to Turn Financial Data Into Better Decisions for Your Consulting Firm
Metrics only matter if they change what a firm does next. Good accounting should drive decisions, not just record what already happened. Here’s how each metric connects to a real decision:
| Decision | Metric It Draws On | What It Prevents |
|---|---|---|
| Pricing & scope decisions | Realization Rate, Project Margin | Repeating underpriced or scope-creeping engagement types |
| Project intervention | Project Margin, WIP tracking | Discovering a loss only after the project closes |
| Billing & collections | WIP, Realization Rate | Revenue sitting unbilled or uncollected longer than it should |
| Resource allocation | Utilization Rate (by person/project) | Consultants are staffed on busy work instead of profitable work |
| Capacity planning | Utilization Rate (trend over time) | Scrambling to staff new work, or sitting on unused capacity |
| Hiring decisions | Contracted revenue vs. pipeline | Staffing up for deals that haven’t actually closed |
| Cross-engagement comparison | Project Margin by engagement type | Retainer, fixed-fee, and hourly work mask each other’s true margins |
None of this requires more data. It requires the data a firm is already generating: hours, invoices, project costs, organized in a way that’s actually usable. That’s exactly the kind of finance procedure 1116 Partners helps consulting firms build.
Get Financial Visibility For Your Consulting Firm With 1116 Partners

As your consulting firm grows, knowing how much revenue you’ve generated is no longer enough. You need to understand which projects are profitable, where your team’s time is creating value, and how every client engagement contributes to long-term growth.
At 1116 Partners, we help growing consulting firms build the financial reporting and accounting infrastructure that gives leadership real visibility into profitability, utilization, cash flow, and project economics- not just reliable books, but numbers you can actually run the business on.
FAQs
-
Consulting accounting is built around project-based revenue, billable hours, and labor as the primary cost, while product-business accounting centers on inventory, cost of goods sold, and transactional sales.
-
WIP is billable work that’s been performed but not yet invoiced. Accurate tracking ensures your financials reflect revenue that’s actually earned, even before the invoice goes out.
-
Utilization rate shows what share of your team’s total capacity is generating revenue, revealing inefficiencies that a raw hours-billed number can hide entirely.
-
Yes. Retainer and project-based engagements typically have different margins and revenue recognition timelines, so reporting them separately provides a clearer picture of what’s actually driving profitability.
-
Monthly, at minimum. Utilization, realization, and project margin all shift quickly, and monthly financial reporting is what catches problems while they’re still small enough to fix.
